Are AI coding agents actually getting better?
Six months of diagnostics data say yes, with caveats
When Kiro IDE's coding agents write or modify code, the diagnostics tool runs static analyzers to check the output. These are the same checks a developer sees underlined in their editor. In practice, the tool catches things like a missing module import (Cannot find module 'aws-cdk-lib' or its corresponding type declarations), an unresolved Java import (The import org.junit cannot be resolved), a type mismatch (Argument of type 'string | undefined' is not assignable to parameter of type 'string'), an implicitly typed any, or an undefined symbol. These are the kinds of issues that would otherwise surface only at build time.
To recap how the diagnostics tool works in Kiro in practice, the screenshot below shows the tool in action: consider the following TypeScript code where the tool reports two type mismatches (Type 'number' is not assignable to type 'string' and Cannot assign to read-only 'executionTime') and a property hallucination (Property 'itemAge' does not exist on type 'StackProps'). These diagnostics give the agent concrete feedback to generate corrections and re-validate the changes. This generate → validate → refine loop occurs frequently when working with statically typed languages, where many common coding errors can be caught early by language servers.
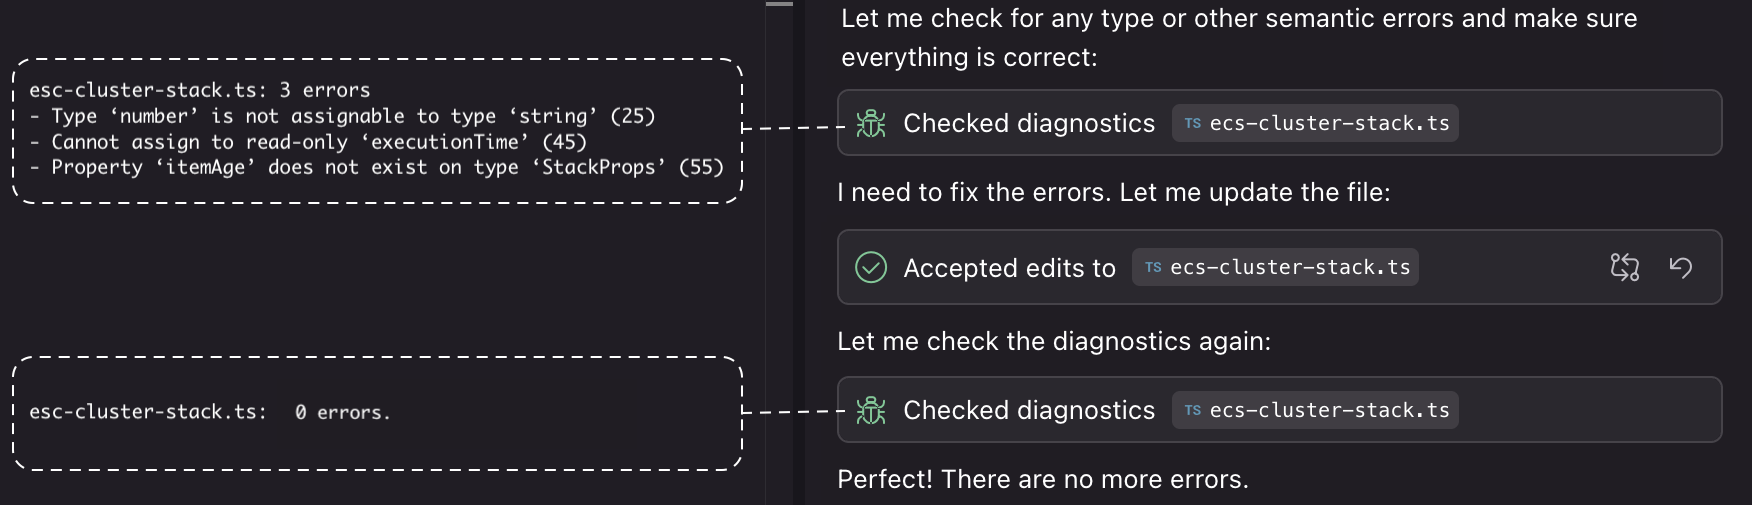
This post examines the agent's diagnostic tool invocations during generation: how often the model voluntarily calls static analyzers mid-task, what errors those analyzers surface, and whether the model resolves them before producing its final edit.
The diagnostics are produced by whatever language extensions the developer has installed in their IDE, so the set of checks varies by workspace configuration. In our data, diagnostics originate from the standard analyzers behind each ecosystem: tsserver for TypeScript/JavaScript, jdtls for Java, Pyright for Python, rust-analyzer for Rust, the Kotlin language server, gopls for Go, clangd for C/C++, and style/correctness linters such as ESLint. We also observed Swift diagnostics (Cannot switch on a value of type Region. Only convertible int values, strings or enum variables are permitted) and, extending beyond conventional compilation errors, Lean 4 theorem-prover diagnostics, where the tool flags not a syntax slip but an incomplete proof (Dependent elimination failed: Failed to solve equation, unsolved goals).
Over the past six months, Kiro has supported different model families and variants, from Opus 4.5 through 4.8 and Sonnet 4 through 4.6.
You might expect newer models to simply generate fewer errors. And while error rates are dropping, the picture is more nuanced than that. These models aren't just making fewer mistakes; they're making different kinds of mistakes. Error categories that dominated earlier generations are disappearing, while new ones are emerging in their place. The overall trajectory is positive, but the shift in error composition is worth understanding. In this article, we share what we found.
Distinguishing final-state quality from intermediate self-correction signals. There are two complementary ways to evaluate whether AI coding agents are improving. The first is post-hoc static analysis: run a fixed set of analyzers on the agent's final output and count residual errors. This measures end-state code quality (the artifact the developer actually receives) and is the most direct proxy for "did the model produce correct code?" The second, which this study examines, is the agent's diagnostic tool invocations during generation: how often the model voluntarily calls static analyzers mid-task, what errors those analyzers surface, and whether the model resolves them before producing its final edit.
This latter signal is strictly more informative about model capability for two reasons. First, it captures the model's capacity for self-monitoring, a behavioral property invisible in final-state measurement, since a model that never checks its work and happens to produce clean code is indistinguishable from one that checks, detects errors, and repairs them. Second, invocation-level data provides a richer decomposition: it reveals which error categories the model generates, which ones it can fix autonomously, and at what cost in additional tool calls, offering a granular view of where model cognition succeeds or fails. Final-state analysis, by contrast, turns this process into a single pass/fail bit. In short, post-hoc analysis tells you what quality the user received; diagnostic invocation data tells you how the model achieved (or failed to achieve) that quality, making it a stronger signal for diagnosing model improvement trajectories over time.
Over a six-month window from January through June 2026, we analyzed approximately 1.5 million conversations in Kiro IDE across seven Claude models (Opus 4.5 through 4.8 and Sonnet 4 through 4.6) spanning several languages including TypeScript, Python, Java, Rust, Go, Kotlin, C++, and Swift. The data came from internal Amazon users.
We extracted 406K diagnostics invocations, the moments where the agent called the built-in tool which uses static-analysis extensions to check code files. Opus 4.5 and 4.6 account for over 51% of the analyzed data, making up the bulk of the volume. Newer Opus models have fewer datapoints. Sonnet 4.5 invocations account for another 45% of all the analyzed requests while Sonnet 4 and 4.6 have fewer datapoints.
Caveats. Three things to keep in mind when interpreting these results.
What we're measuring, and what we're not. The diagnostics analyzed here come from Kiro IDE's Diagnostics Tool, which runs after the coding agent performs file edits. It relies on extensions installed in the user's environment, typically language servers and static analyzers (TypeScript's tsc, ESLint, Pylint, etc.) as well as infrastructure-related extensions like CloudFormation and Terraform validators that check resource properties, required arguments, and resource references before deployment. This means we're capturing only a subset of issues. Runtime errors, logic bugs, performance regressions, and anything requiring dynamic analysis or testing are invisible to this data. A clean diagnostic check does not mean correct code; it just means that the code passes static analysis.
Environment varies across users. Available diagnostics depend on the user's installed extensions. A developer with strict ESLint rules and a CloudFormation validator will surface more warnings than one with a minimal setup. This makes cross-user comparisons noisy and means aggregate error rates reflect a blend of coding quality and tooling strictness. In practice, one should evaluate AI coding quality by stack, by language, and by environment in addition to error rate. That said, because our data comes from Amazon-internal users who share common tooling standards and best practices, environment variability in this dataset is likely narrower than it would be across the general developer population.
Model improvements aren't the only variable. The diagnostics don't run in isolation. They operate within a broader system that includes steering prompts, hooks, subagents, and other orchestration layers that shape how models generate code. Changes to any of these components over the six-month window could affect error rates independently of model capability improvements. We cannot cleanly attribute the improvements shown here to model upgrades alone. Some portions likely reflect better surrounding infrastructure. Disentangling the two would require controlled experiments that hold the orchestration layer fixed, which this observational data doesn't provide.
We first examined the diagnostics invocation rate: the fraction of coding conversations in which the model chose to call the diagnostics tool at least once. This ratio captures how proactively a model uses available diagnostic tooling to check its own work.
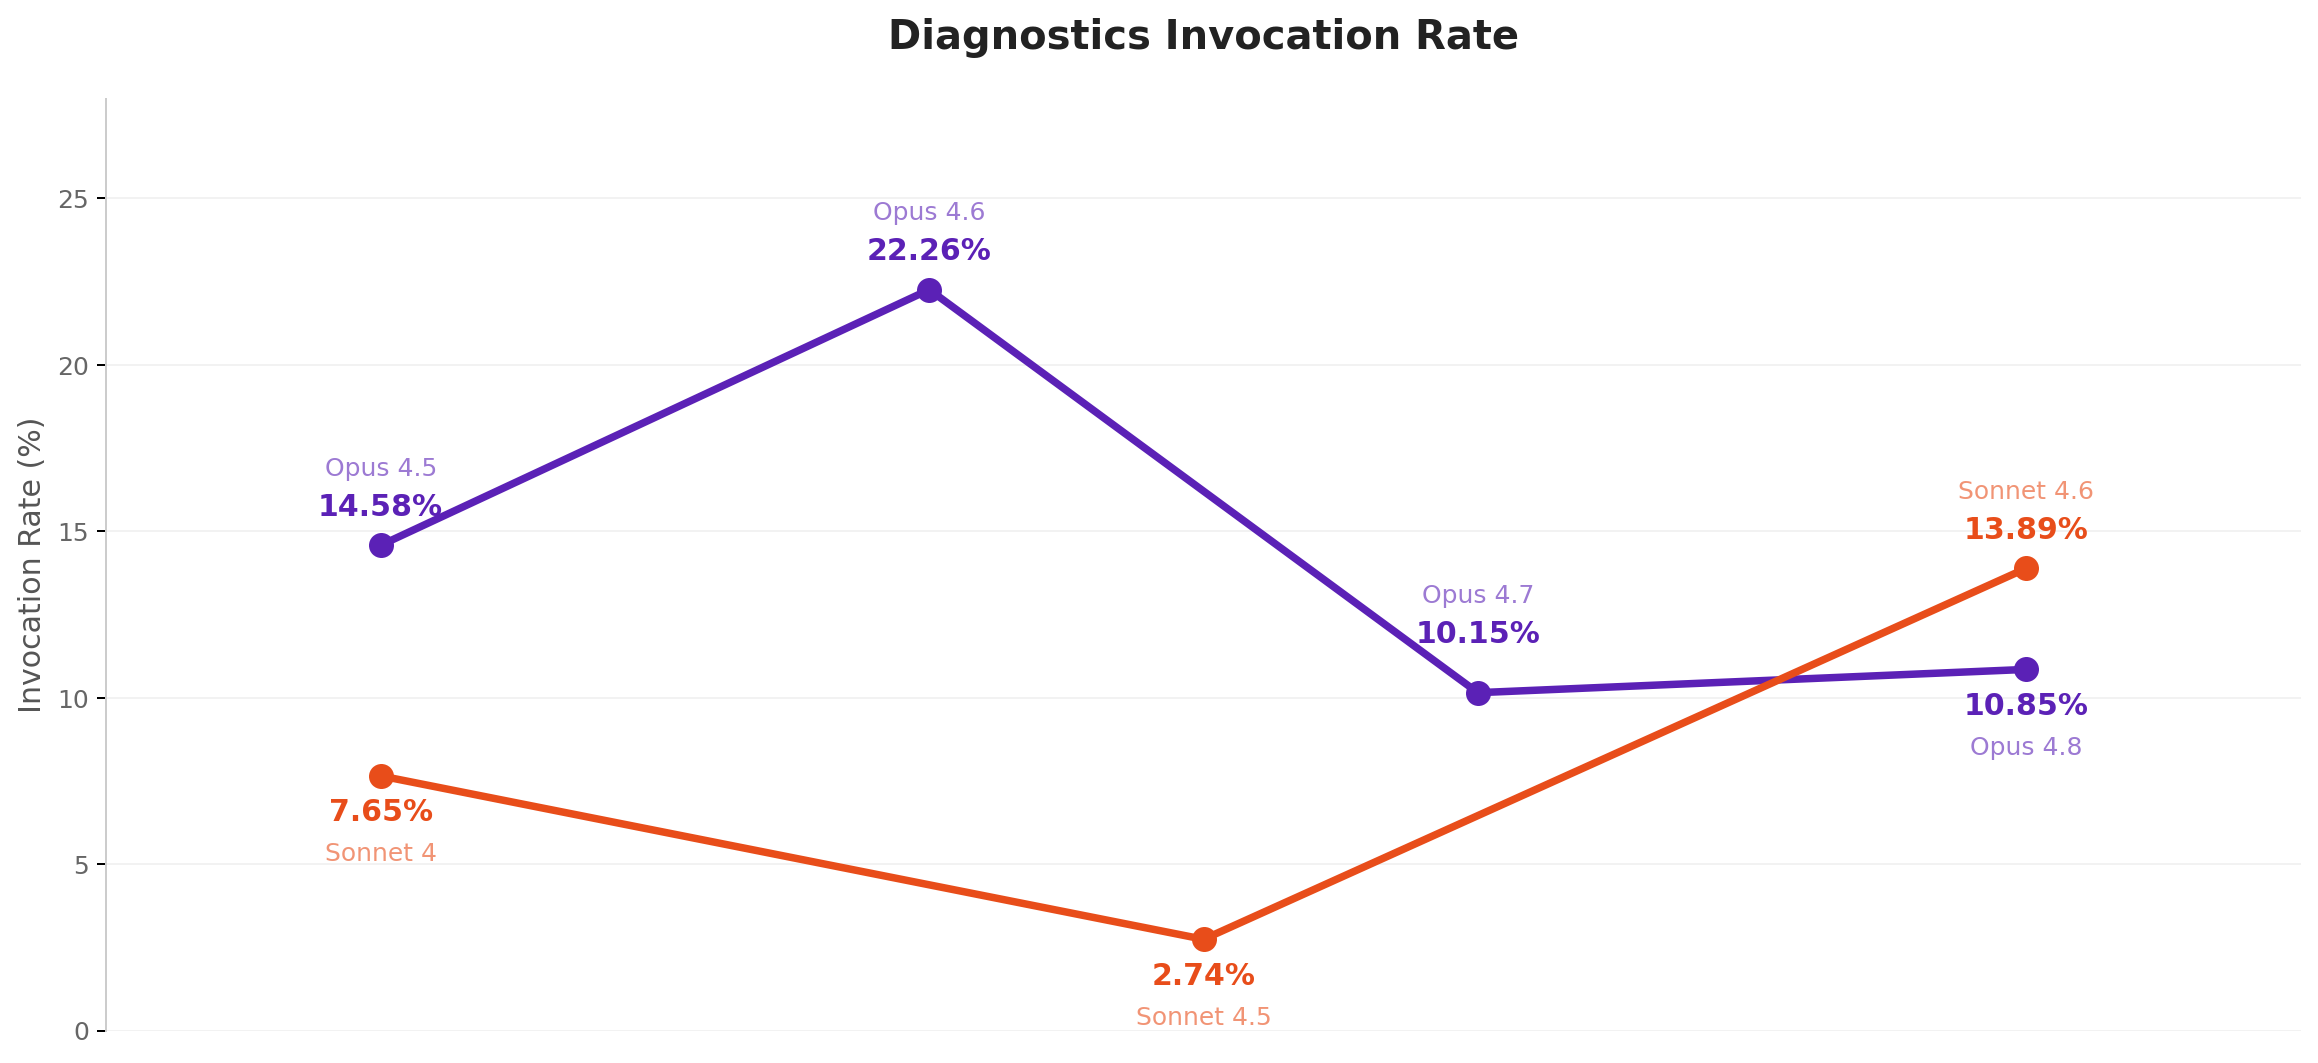
Opus 4.6 stands out as the most proactive, invoking diagnostics in 22.26% of its conversations. However, subsequent Opus versions (4.7 and 4.8) dropped back to ~10%. The Sonnet family tells a different story: Sonnet 4.5 barely invoked diagnostics at all (2.74%), but Sonnet 4.6 jumped to 13.89%, which is a large increase that signals growing awareness of the tool. Overall, invocation rates are roughly 3-22%, indicating that most conversations are still completed without the model proactively checking for statically found errors. This is consistent with recent findings that models default to their training-time tools and rarely use diagnostic tooling without explicit prompting or fine-tuning. Similar experiments suggest that using diagnostics to block the agent from finalizing until errors are resolved can significantly reduce acceptance of incorrect code from ~90% to ~8%, a far larger effect than merely making diagnostics available as an optional tool.
We compared the average number of errors reported per file across successive model versions. This metric captures how "close to compile" the generated code is. Even when it doesn't fully succeed, fewer errors per file means less manual fixing.
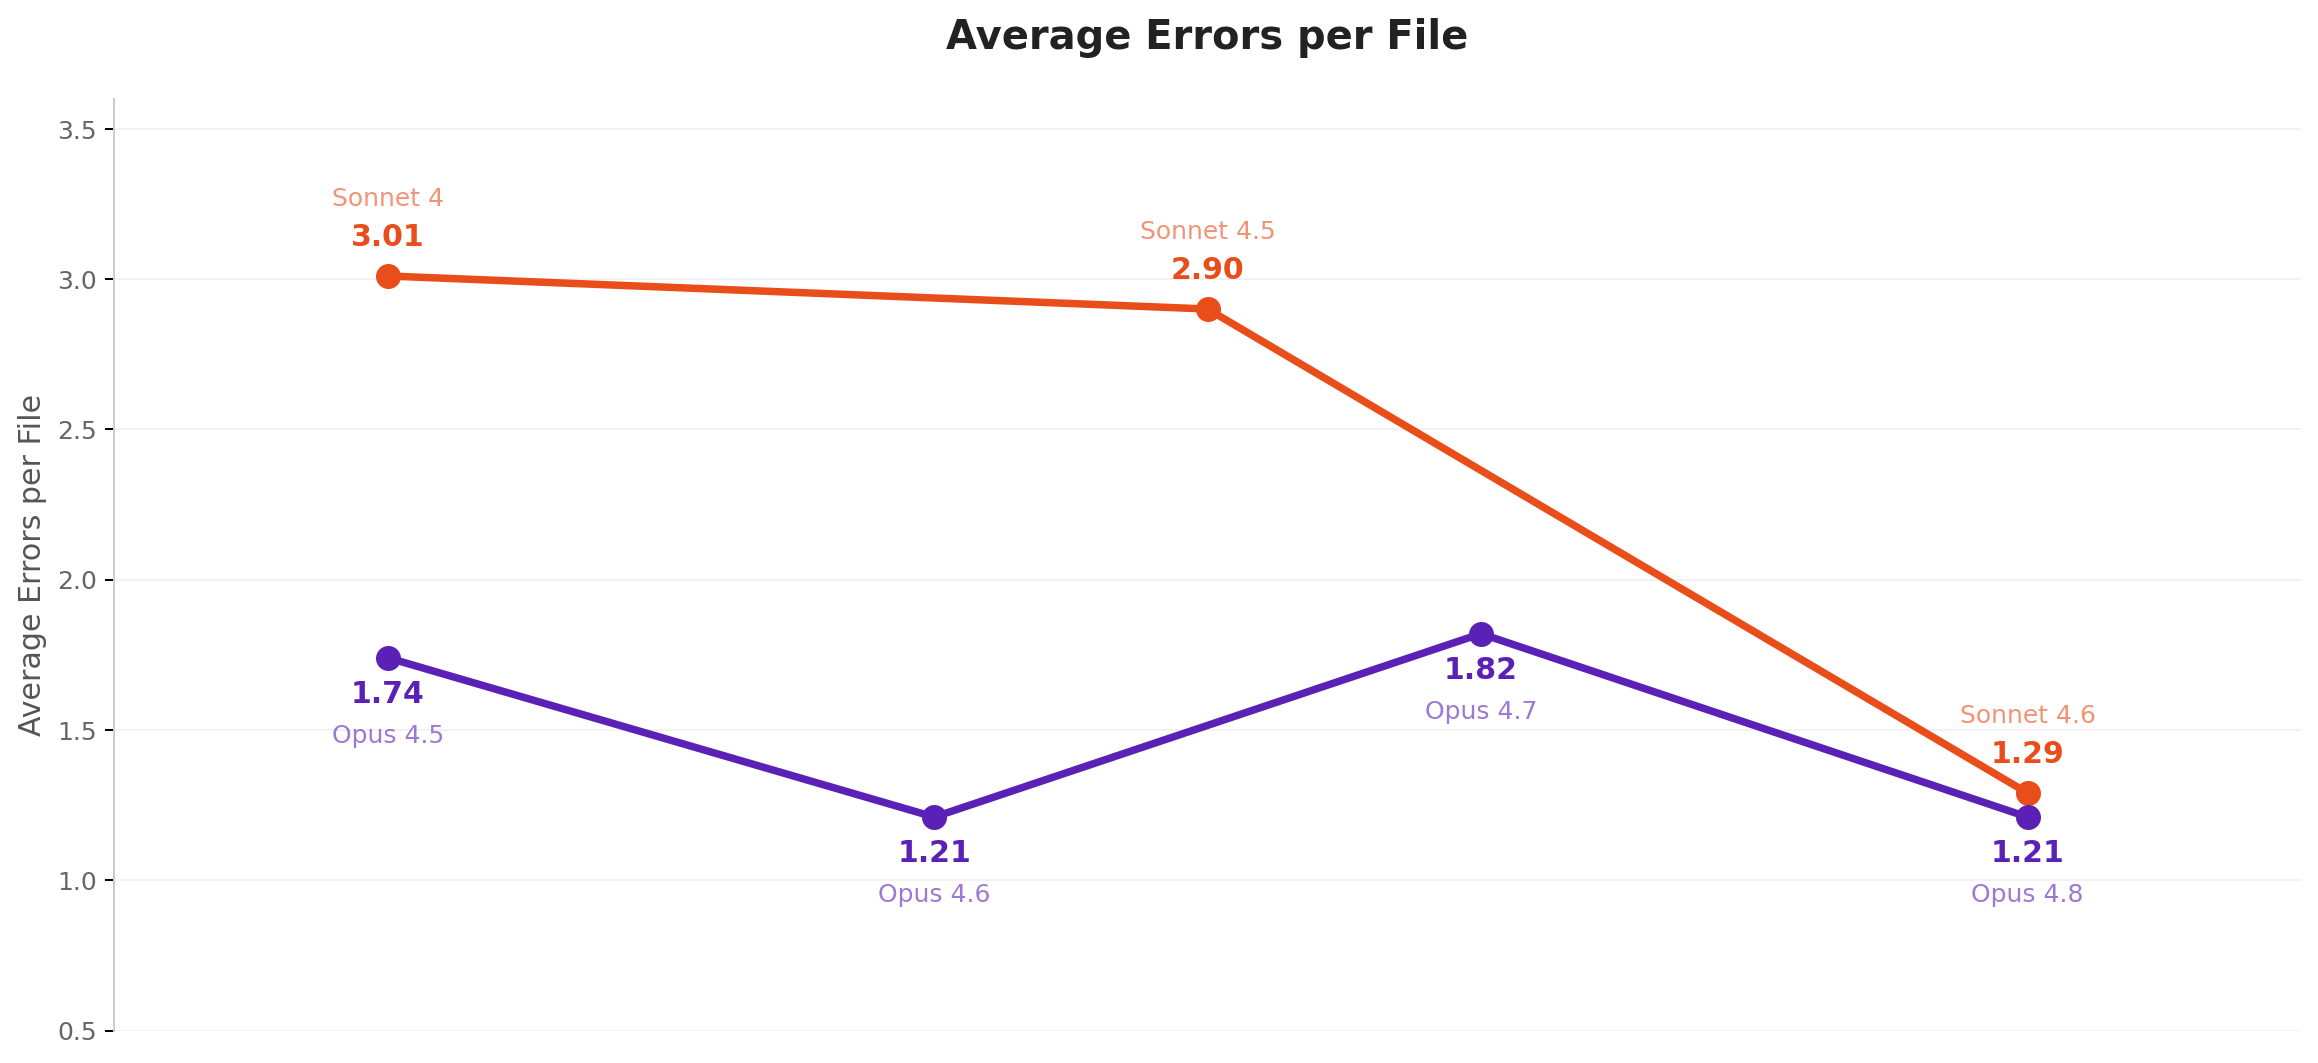
The Sonnet line tells a clear improvement story. From 3.01 errors per file in Sonnet 4 down to 1.29 in Sonnet 4.6, we observed a 57% reduction. The Opus family shows a non-monotonic pattern. Opus 4.6 and 4.8 both hit 1.21, while Opus 4.5 and 4.7 sit higher around 1.7-1.8. This may suggest that within the Opus family, not every version represents a strict improvement in terms of statically found diagnostics. Overall, both families converge toward roughly 1.2 errors per checked file in the latest versions of our study. This may indicate meaningful progress toward models that produce compilable code out of the box.
Beyond error rates, we noticed something interesting about how models use the diagnostics tool. Newer models are checking more files per invocation.
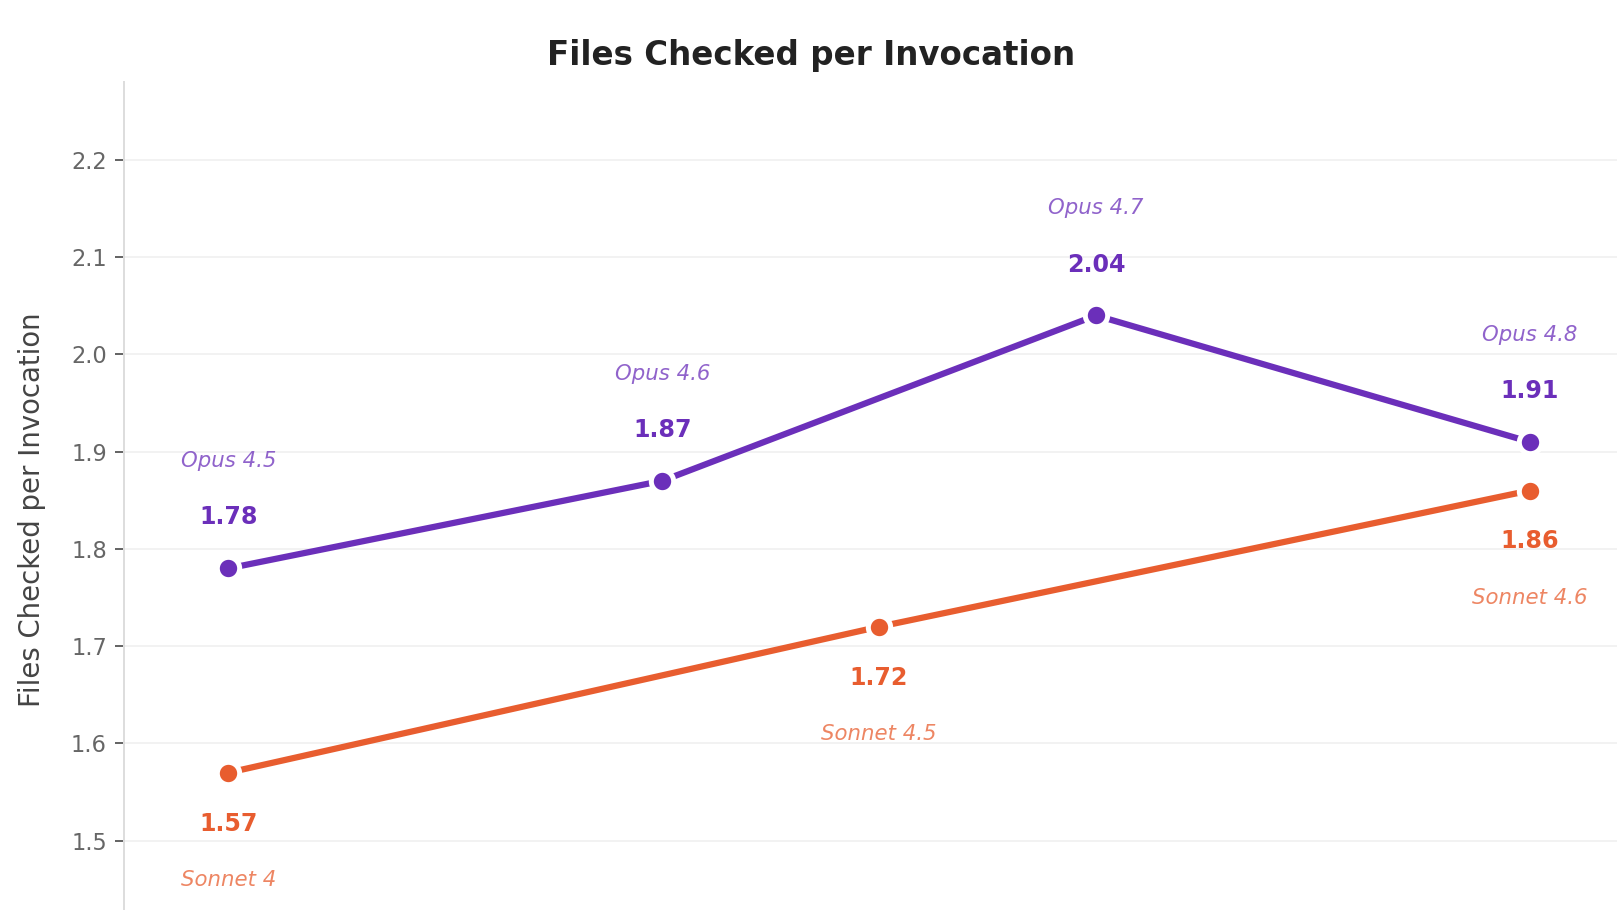
Early on, Sonnet 4 checked an average of 1.57 files each time it called diagnostics, essentially one file at a time, maybe a second file occasionally. By Sonnet 4.5 that crept up to 1.72, and Sonnet 4.6 reached 1.86. The Opus family shows a similar trend. Opus 4.5 averaged 1.78 files per call; Opus 4.6 hit 1.87; Opus 4.7 peaked at 2.04; and Opus 4.8 settled at 1.91.
This matters because it represents a shift in code-checking strategy. Rather than editing a file and checking only that file, newer models are increasingly checking related files together, e.g., the implementation and its test, or a module and its consumers.
The move from ~1.6 files/call to ~2.0 files/call may sound modest, but across hundreds of thousands of invocations it means models are catching cross-file regressions (e.g., broken imports, interface mismatches, and downstream type errors) more often than earlier generations.
To understand what the diagnosed errors are, we categorized error kinds and visualized the distribution for each model independently.
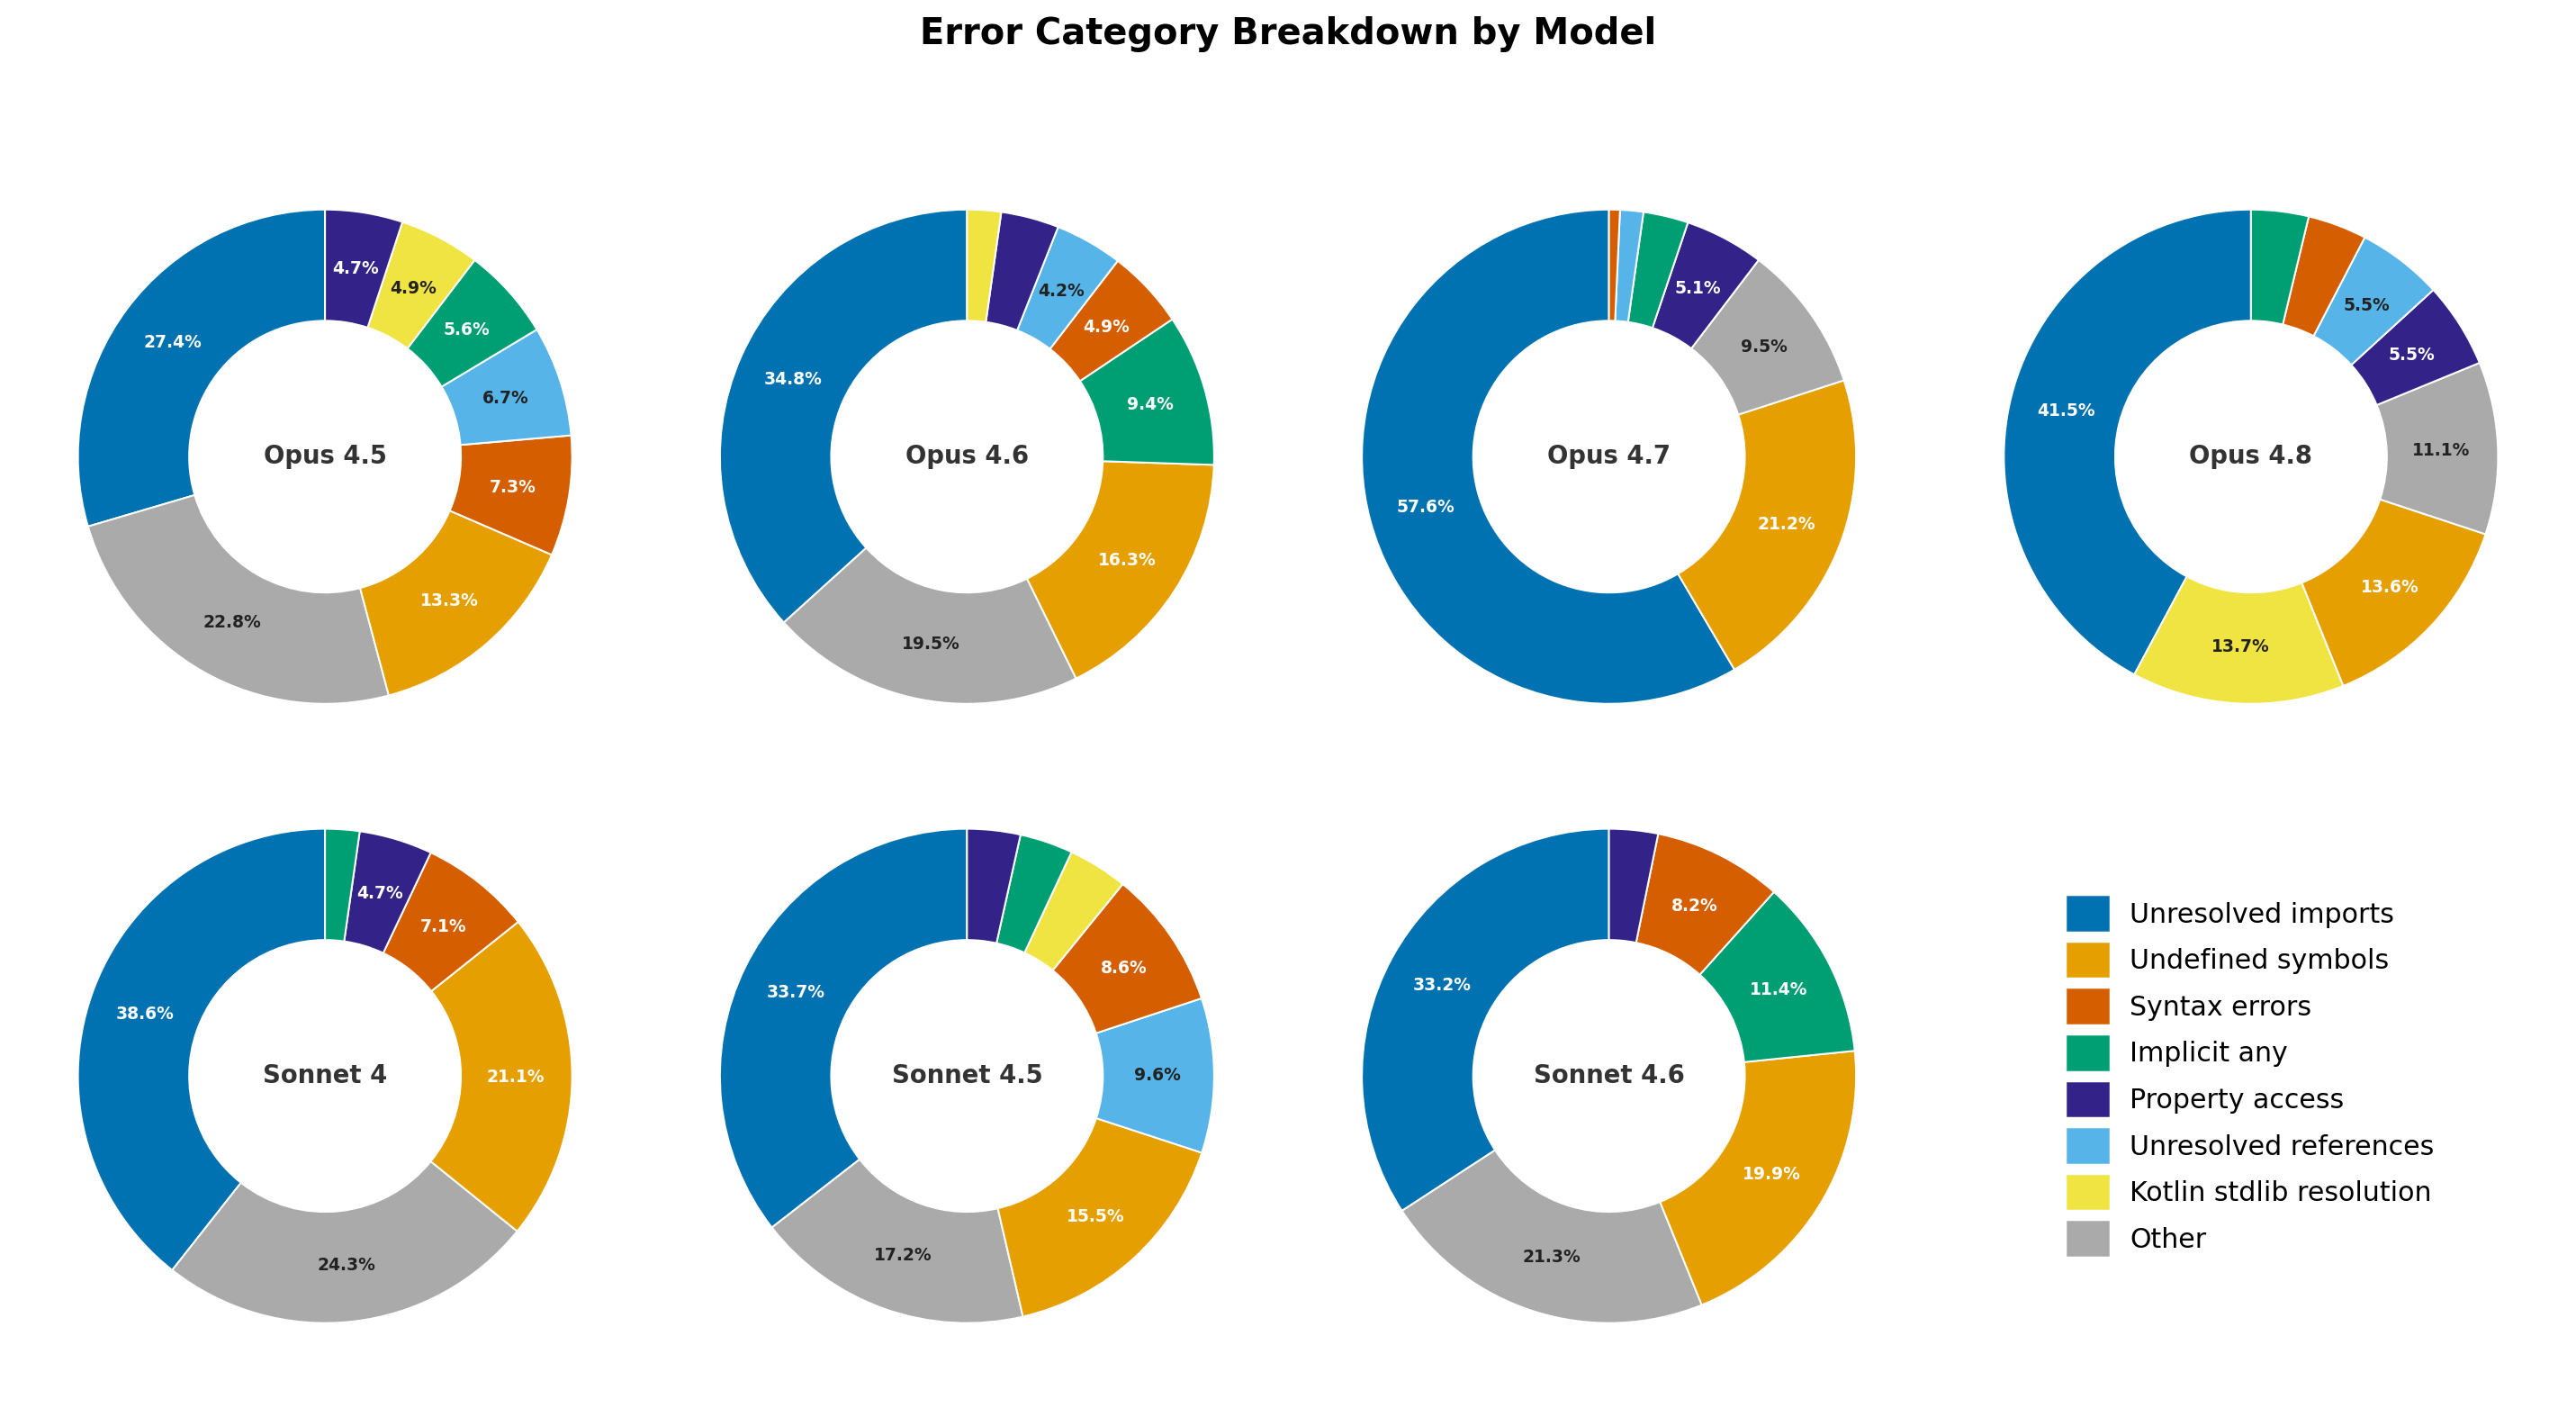
Across all models, "unresolved imports" is the single largest error category, accounting for roughly a third of all diagnostics in most cases, and over half in Opus 4.7. "Undefined symbols" and a long tail of type-system errors (syntax errors, unresolved references, implicit any, etc.) make up the remainder. Notably, the error distribution differs across models: Opus 4.7 is heavily dominated by import resolution failures with comparatively few other error types, while models like Sonnet 4.5 and Opus 4.5 exhibit a more evenly distributed spread across categories. This may suggest that different models fail in different ways. Some struggle primarily with dependency resolution, while others distribute mistakes more broadly across the type system and symbols.
Test code is consistently harder for models to get right. Tests involve mocking frameworks, assertion libraries, and complex setup patterns that require understanding both the testing tool and the code under test.
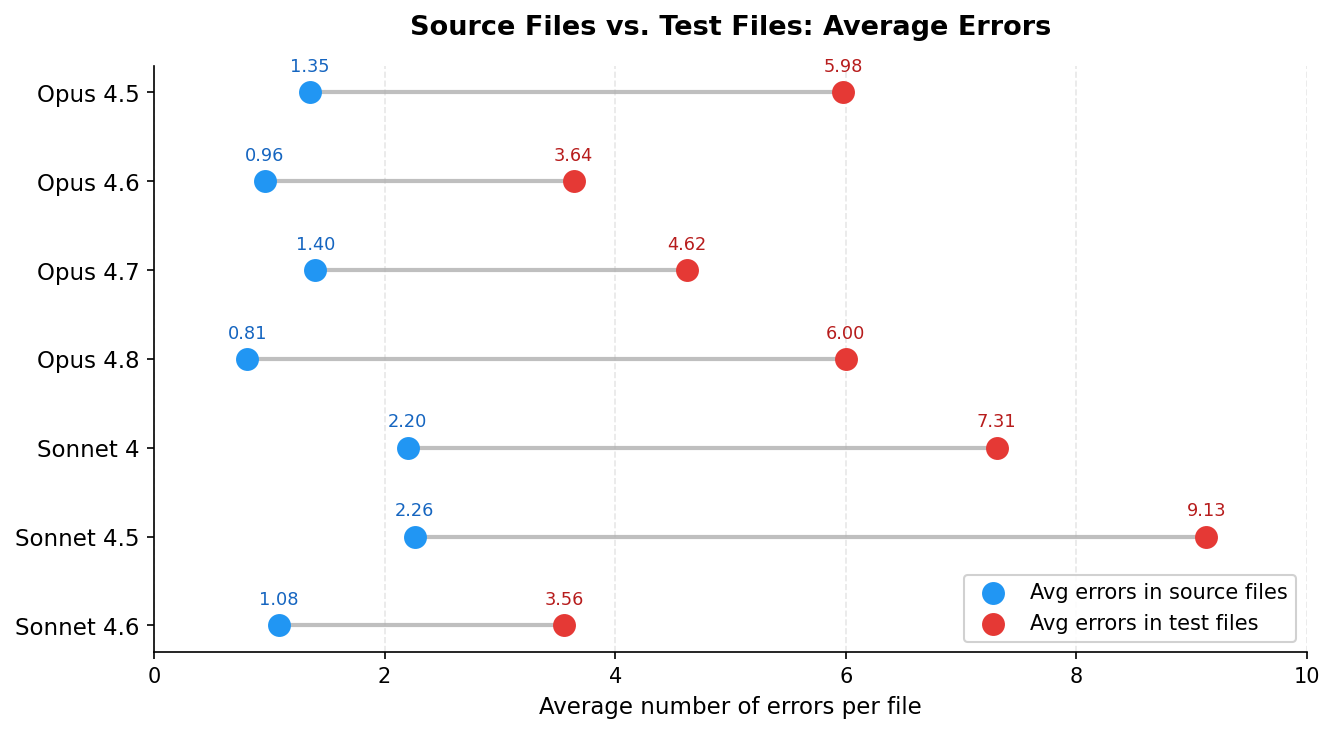
The Opus family generally keeps source-file errors below 1.4, yet their test-file errors range from 3.64 (Opus 4.6) to 6.00 (Opus 4.8). Sonnet 4.5 shows the widest gap, with 2.26 errors per source file but 9.13 per test file. Sonnet 4 produces 2.20 source errors and 7.31 test errors, while Sonnet 4.6 is the strongest Sonnet variant at 1.08 and 3.56 respectively. It appears that regardless of model size or generation, test files remain the dominant source of errors.
Some languages introduce more errors than others when generating code. Looking at file-level error rates from Opus 4.6 (our largest traffic), the spread is enormous. That said, these numbers are shaped by two factors beyond model capability: the precision of the static analysis extensions customers have installed (stricter linters surface more issues), and the variation in how Kiro IDE's user base uses each language.
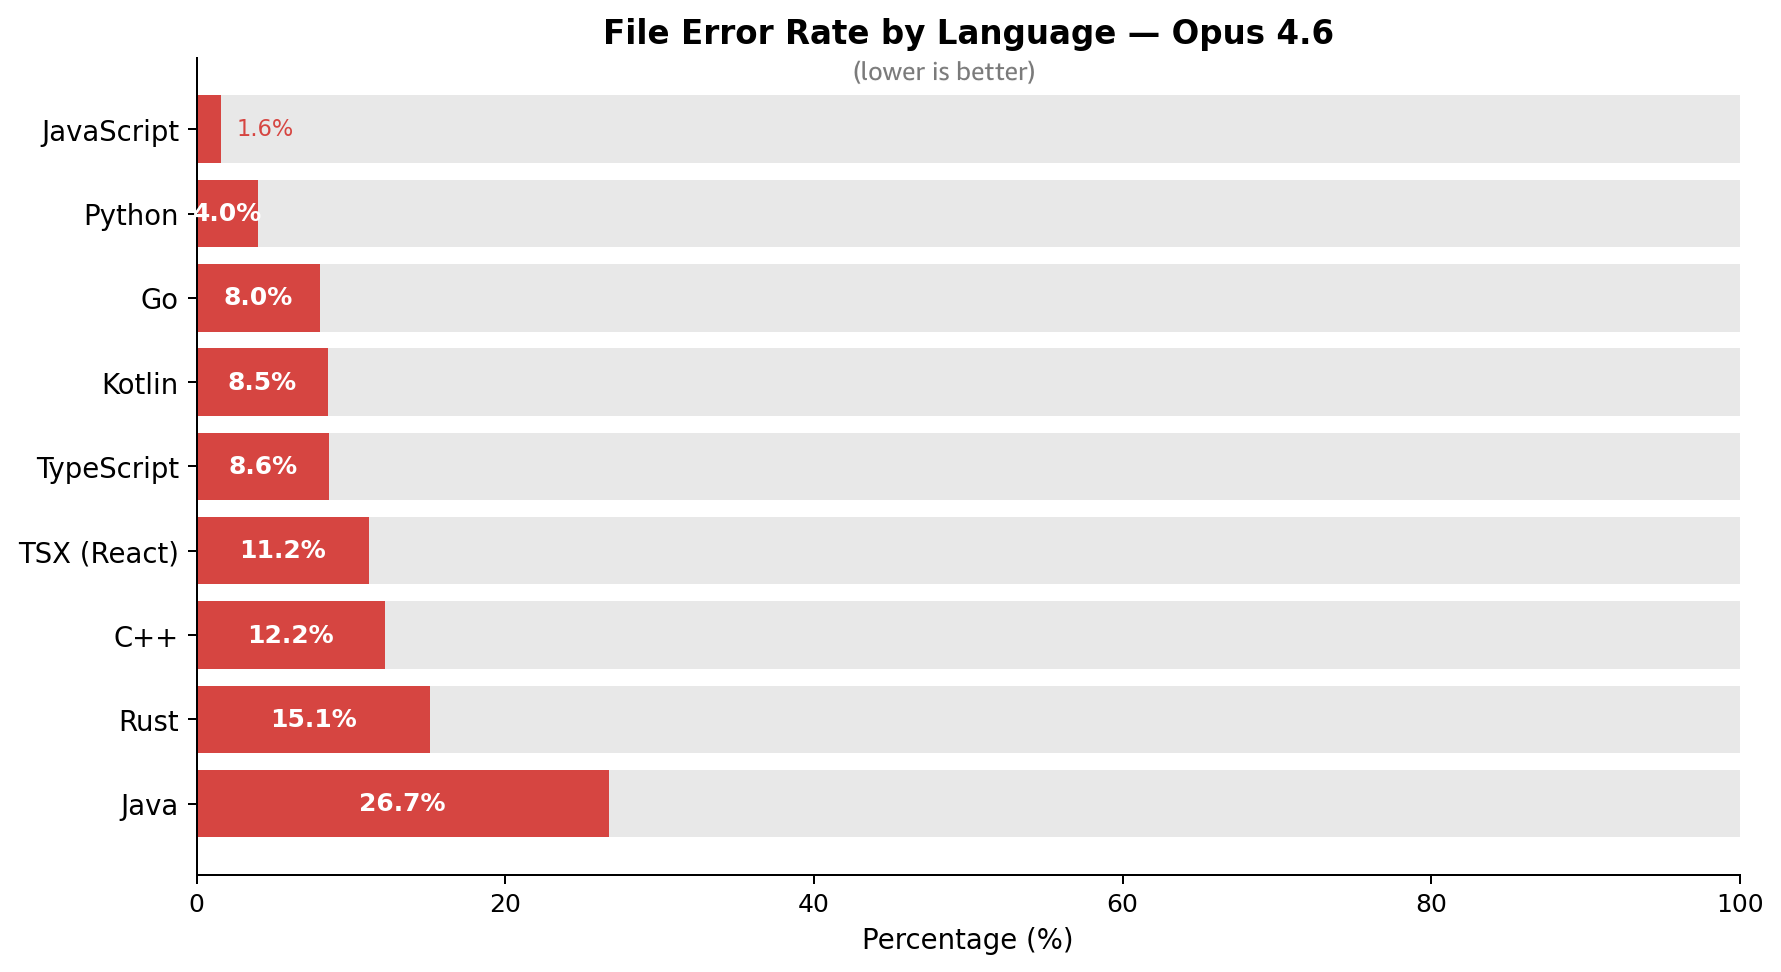
Java sits at the top with a 26.7% file error rate. It means more than one in four generated Java files contain at least one diagnostic error. The combination of verbose imports, complex generics, checked exceptions, and strict type resolution makes it the hardest language for AI models we analyzed in this study, by a wide margin. Rust comes next at 15.1%, followed by C++ at 12.2%.
The middle tier consists of TSX/React, TypeScript, Kotlin, and Go, in which error rate is in the 8-11% range. These are statically typed languages with enough structure to trip up the model, but not as stringent as Java.
At the bottom sit Python (4.0%) and JavaScript (1.6%). Python's dynamic typing, lack of import boilerplate, and forgiving syntax produce consistently clean results. JavaScript's rock-bottom 1.6% is a bit misleading. It reflects the minimal static analysis available for vanilla JS rather than the model writing better code. When you add TypeScript's type system on top, the rate jumps to 8.6%. The same caveat that applies to JavaScript applies more subtly to Python. As a dynamically typed language with typically light static analysis, some Python errors do not surface as diagnostics until runtime. So, a low static error rate reflects what's catchable at edit time, not that the code is necessarily more correct than Java, where the compiler catches nearly everything up front.
If your team is using AI coding agents heavily on Java codebases, expect to spend more time on diagnostics cleanup than Python or TypeScript codebases.
Six months and nearly half a million diagnostics invocations show us that AI coding agents are measurably improving at writing correct code, but the picture is more nuanced than a single number.
- Error rates are dropping. Both model families converge to ~1.2 errors/file in their more powerful versions.
- Models invoke the diagnostics tool proactively in 3-22% of conversations.
- Newer models check more files at once. In more recent models, related files (e.g., implementation along with its tests) are more commonly checked together.
- Unresolved imports dominate. They account for ~30–58% of all errors regardless of model.
- Test code appears 3-4x harder to get right. Mocking frameworks and assertion libraries consistently produce far more errors than implementation files.
- Language matters. Java's error rate (26.7%) is 6.7x Python's (4.0%); JavaScript's low 1.6% reflects weak static analysis rather than better generation.
Diagnostics run automatically as Kiro's agents write and refine code. To see how it works and go deeper, read the diagnostics documentation and the models overview, and download Kiro to try it on your own codebase.